


By continuing to truly focus upon babies, we want to make the world more baby-friendly.
At the same time, we aim to achieve sustainable growth as a company by reducing environmental impact and solving social issues surrounding babies and mothers in all countries and regions where we conduct business activities. We particularly recognize the urgency of climate change. Pigeon’s Seventh Medium-Term Business Plan identifies climate change as one of the most important management challenges and outlines measures to tackle it.
| TCFD Report | CO2 Emissions Reduction Targets and Performance |
CO2 Emissions Reduction Targets and Performance
In our 7th Medium-Term Business Plan (2020–2022), we set the companywide target of reducing Scope 1 & 2 CO2 emissions per sales in FY2022 by 10% compared to FY2018, and have promoted activities to achieve the target.
|
Target for FY2022
Result in FY2021
11.7% reduction from 2018 base year
|

|
(Scope 1 & 2)10%from 2018 base year.
from 2018 base year
Note: The values of intensity for FY2018, FY2019 and FY2020 have been restated as a result of recalculation of net sales according to the revised Accounting Standard for Revenue Recognition. This reduction target covers the total emissions of scope 1 and scope 2 emitted from Pigeon Corporation and all of the consolidated subsidiaries in Japan and overseas. (The target coverage is 100%)
Pigeon Group CO2 Emissions (Scope 1 & 2)
Our CO2 emissions across the entire group in FY2021 were 2,855 tonnes for Scope 1 and 20,655 tonnes for Scope 2 (total: 23,510 tonnes). Scope 1&2 emissions decreased by 4,693 tonnes (16.6%) compared to FY2018.
Unit: tonnes of CO2
| Business segment | FY2018 (base year) |
FY2019 | FY2020 | FY2021 | |||
| CO2 Emission | CO2 Emission | Reduction (vs. FY2018) |
CO2 Emission | Reduction (vs. FY2018) |
CO2 Emission | Reduction (vs. FY2018) |
|
| Group total | 28,203 | 26,931 | -1,272 | 24,973 | -3,230 | 23,510 | -4,693 |
|---|---|---|---|---|---|---|---|
| Japan Business | 6,232 | 5,496 | -737 | 5,265 | -967 | 3,947 | -2,285 |
| China Business | 9,884 | 8,886 | -998 | 8,923 | -961 | 8,737 | -1,147 |
| Singapore Business | 11,305 | 11,306 | 1 | 10,442 | -863 | 10,610 | -695 |
| Lansinoh Business | 782 | 1,243 | 461 | 343 | -439 | 216 | -566 |
Note: The CO2 emissions for FY2018, FY2019 and FY2020 have been restated due to a review of past data.
■Boundary of calculationsPigeon Corporation and all of the consolidated subsidiaries in Japan and overseas.(Coverage is 100%)
The financial control approach is used to consolidate CO2 emissions.
Scope 1 emissions: Calculations are based on energy-derived CO2 emission. For the Japan business unit, CO2 emission factors specified in Japan's Act on Promotion of Global Warming Measures are applied. For the overseas businesses, CO2 emission factors published by local governments are used where available, otherwise, the emission factors published by IPCC or specified in Japan's Act on Promotion of Global Warming Measures are used.
Scope 2 emissions: Where supplier-specific CO2 emission factors are available, those are applied. Otherwise, the average CO2 emission factors of the local country or electricity grid are applied. CO2 emission factors for electricity consumption corresponding to the amount of purchased Renewable Energy Certificates are set to zero.
Independent Verification on CO2 emissions
To enhance the credibility of CO2 emissions data, we engaged third parties to provide verifications on Scope 1 and scope 2 CO2 emissions.
Subsidiaries that their emissions were independently verified in 2022
3 subsidiaries in Japan and 6 subsidiaries overseas shown as below have completed third-party verifications on Scope 1 and scope 2 CO2 emissions for FY2021. (As of December 2022)
A total of scope 1 and scope 2 CO2 emissions for these 9 subsidiaries was 16,619 tonnes of CO2 in FY2021, this account for 70.7% of 23,510 tonnes of CO2 for the Pigeon Group.
| Verified Organization | Verification agency |
Issue Date of |
|
Pigeon Home Products Corporation |
Japan Quality Assurance Organization | June 7, 2022 |
| Pigeon Manufacturing (Shanghai) Co., Ltd. | SGS-CSTC Standards Technical Services Co., Ltd. | September 9, 2022 |
Pigeon Industries (Changzhou) Co., Ltd. |
Hangzhou WIT Assessment Co., Ltd. | July 27, 2022 |
| Pigeon India Pvt. Ltd. | URS Verification Pvt. Ltd. | June 8, 2022 |
| Pigeon Industries (Thailand) Company Limited | LRQA (Thailand) Ltd. | June 20, 2022 |
| Thai Pigeon Co., Ltd. | LRQA (Thailand) Ltd. | October 25, 2022 |
| Lansinoh Laboratories Inc. | GUTcert | August 29, 2022 |
Subsidiaries that their emissions were independently verified in 2021
3 subsidiaries in Japan and 4 subsidiaries overseas shown as below have completed third-party verifications on Scope 1 and scope 2 CO2 emissions for FY2020. A total of scope 1 and scope 2 CO2 emissions for these 7 subsidiaries was 14,684 tonnes of CO2 in FY2020, this account for 58.8% of 24,973 tonnes of CO2 for the Pigeon Group.
| Verified Organization | Verification agency |
Issue Date of |
|
Pigeon Home Products Corporation |
Japan Quality Assurance Organization | November 26, 2021 |
| Pigeon Manufacturing (Shanghai) Co., Ltd. | SGS-CSTC Standard Technical Services Co., Ltd. | June 25, 2021 |
| Pigeon India Pvt. Ltd. | BSI India | November 27, 2021 |
| Pigeon Industries (Thailand) Company Limited | Lloyd’s Register International (Thailand) Ltd. | August 30, 2021 |
| Thai Pigeon Company Limited | Lloyd’s Register International (Thailand) Ltd. | August 30, 2021 |
Scope 3 GHG emissions
Pigeon Group recognizes the need to identify not only Scope 1 and Scope 2 greenhouse gas emissions from our production and non-production sites, but also greenhouse gas emissions throughout the entire value chain, including raw materials, OEM products outsourcing, transportation, use of sold products, and end-of life treatment of sold products (scope 3 emissions) and the need to work with our business partners to reduce scope 3 emissions.
For this reason, we first calculated scope 3 GHG emissions in FY2020 and FY2021 for our Japan Business and Lansinoh Business.
In addition, we are in the process of calculating global scope 3 emissions for fiscal 2021, including our China Business and Singapore Business.
Scope 3 GHG emissions of Japan and Lansinoh Business
|
Categories |
FY2020 |
FY2021 |
| Purchased goods and services | 120.6 | 101.3 |
| Capital goods | 2.3 | 2.8 |
| Fuel-and energy-related activities | 1.1 | 0.8 |
| Upstream transportation and distribution | 6.8 | 6.6 |
| Waste generated in operations | 3.0 | 3.0 |
| Business travel | 0.3 | 0.1 |
| Employee commuting | 1.2 | 1.3 |
| Downstream transportation and distribution | 3.4 | 1.9 |
| Use of sold products | 5.1 | 4.4 |
| End-of-life treatment of sold products | 10.8 | 9.5 |
| Franchises | 0.02 | 0.02 |
The calculation covers our Japan Business and Lansinoh Business. These businesses accounted for 55%* of consolidated net sales in FY2021. (Coverage is 55% on net sales basis)
Please refer to "Scope 3 Greenhouse Gas Emissions for Japan Business" for the details of organizational boundaries and calculation methods for Japan Business.
*Before eliminating inter-segment transactions.
Scope 3 Greenhouse Gas Emissions of Japan Business
The Scope 3 greenhouse gas emissions of Japan Business for FY2021 were calculated as a total of 112 thousand tonnes of CO2e for all categories*1 included in the calculation, resulted 15% reduction from the previous year. The largest proportion of this was made up of Category 1 emissions (from purchased goods and services), which accounted for 88 thousand tonnes of CO2e. GHG emissions accompanying purchases of nonwoven fabrics and baby drinks made up a large portion of these emissions.
In 2022, we will calculate our Scope 3 greenhouse gas emissions, with our China Business and Singapore Business included in the scope for calculation.
*1 Of the 15 categories defined in the GHG Protocol, we calculate emissions in 10, excluding the 5 categories of Upstream Leased Assets, Downstream Leased Assets, Downstream Transportation and Distribution, Processing of Sold Products, and Investments.
GHG Emissions of Japan Business
| Scope and Categories | FY2020 | FY2021 |
| Scope 1 (Thousand tonnes of CO2) | 1 | 1 |
| Scope 2 (Thousand tonnes of CO2) | 3 | 3 |
| Scope 3 (Thousand tonnes of CO2e) | 132 | 112 |
| Purchased Goods & Services | 106 | 88 |
| Capital Goods | 2 | 2 |
| Fuel-and energy-related activities | 1 | 1 |
| Upstream Transportation & Distribution | 5 | 5 |
| Waste Generation in Operations | 3 | 3 |
| Business Travel | 0.2 | 0.1 |
| Employee Commuting | 1 | 1 |
| Use of Sold Products | 5 | 4 |
| End-of-Life Treatment of Sold Products | 9 | 8 |
| Franchises | 0.02 | 0.02 |
■Boundary of calculations
Pigeon Corporation, Pigeon Home Products Corporation, Pigeon Manufacturing Hyogo Corporation, Pigeon Manufacturing Ibaraki Corporation, Pigeon Tahira Corporation, Pigeon Hearts Corporation, Pigeon Manaka Corporation
■Calculation methods for scope 3 emissions
GHG emissions are calculated using "Database of emissions unit values for calculating greenhouse emissions throughout the supply chain Ver.3.1 (July, 2021)", published by Japan's Ministry of the Environment and Ministry of Economy, Trade and Industry, hereafter, "Emission factors DB", as well as the "LCI database IDEA version 2.3" developed by the IDEA lab for Society and LCA of Research Institute of Science for Safety and Sustainability, National Institute of Advanced Industrial Science and Technology(AIST) .
Purchased Goods & Services: GHG emission is calculated for products sold in Japanese market by Pigeon Group as a general rule. GHG emissions from products purchased from other companies, and raw materials and other materials purchased to produce our own products are calculated. It excludes purchased products and materials for exports to overseas and any purchase of raw materials and other materials consumed to produce OEM products produced based on requests from other companies. For the products and materials those weight are identified, GHG emissions are calculated based on the weight of each product/material. However, for those items of which weight were not identified, purchased monetary amounts are used for calculations. In addition, purchased goods and services accounted as advertising expense, sales and promotion expense, research and development expense and manufacturing supplies expense, which are relatively large portions of sales and general administrative expenses, are included in the calculation.
Use of Sold Products: This category covers emissions from the use of Pigeon's electric appliances such as Electric Breast Pumps, Electric Milk Warmers, Electric Nose Cleaners, as well as emissions derived from energy consumed when Pigeon's nursing bottle users sterilize their nursing bottles by boiling or by using microwaves. The numbers of Pigeon's nursing bottle users, the numbers of each user who sterilie by boiling and by using microwave are based on our own estimations.
End-of-Life Treatment of Sold Products: Products those weight are identified are in the scope of the calculation. Emissions are caluclated by using an emission factor by waste type included in Table 9 of Emission Factors DB.
Franchises: This category covers childcare business.
Lansinoh Group's Long-term Targets for Reduction of Greenhouse Gas Emissions
We recognize the importance of addressing climate change throughout our value chain. In FY2020, our Lansinoh Group set a long-term goal of achieving climate neutrality by 2030 and committed to net zero emissions by 2050 for the entire value chain. These plans align with the Paris Agreement, which strives to limit global warming to 1.5℃ above pre-industrial levels. The corresponding near-term reduction targets by 2030 were validated and approved by the Science Based Target Initiative (SBTi ) in FY2020.
The net-zero commitment covers scopes 1, 2, and 3 of the entire Lansinoh business, which accounts for 14.3%* of consolidated net sales. (2021 actual)
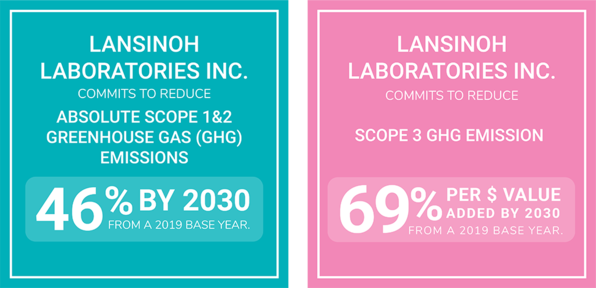
Categories covered by Scope 3 reduction targets and Net Zero committment,
Category 1: Purchased goods and services, Category 2: Capital goods, Category 4: Upstream transportation and distribution, Category 5: Waste generated in operations, Category 6: Business travel,
Category 7: Employee commuting, Category 9: Downstream transportation and distribution, Category 12: End-of-life treatment of sold products
Lansinoh Group's Greenhouse Gas Emissions (Scopes 1, 2 and 3)
|
|
FY2019 |
FY2020 |
FY2021 |
|||
| tonnes-CO2e | Ratio | tonnes-CO2e | Ratio | tonnes-CO2e | Ratio | |
| Scope 1 Total | 118 | 1% | 83 | 0% | 95 | 0% |
|---|---|---|---|---|---|---|
| Scope 2 Total | 937 | 5% | 288 | 1% | 1 | 0% |
| Scope 3 Total | 19,651 | 95% | 22,641 | 98% | 19,349 | 100% |
| Purchased Goods & Services | 12,705 | 61% | 14,647 | 64% | 13,139 | 68% |
| Capital Goods | 353 | 2% | 342 | 1% | 324 | 2% |
| Fuel and energy-related activities | 124 | 1% | 126 | 1% | 130 | 1% |
| Upstream Transportation Distribution | 1,480 | 7% | 1,838 | 8% | 1,817 | 9% |
| Waste Generation in Operations | 5 | 0% | 6 | 0% | 7 | 0% |
| Business Travel | 577 | 3% | 92 |
0% |
13 |
0% |
| Employee Commuting | 319 | 2% | 211 | 1% | 91 | 0% |
| Downstream Transporation & Distribution | 2,244 | 11% | 3,428 | 15% | 1,883 | 10% |
| Use of Sold Products | 101 | 0% | 108 | 0% | 99 | 1% |
| End-of-Life Treatment of Sold Products | 1,743 | 8% | 1,843 | 8% | 1,845 | 9% |
| Scope 1, 2 & 3 Total | 20,706 | 100% | 23,012 | 100% | 19,445 | 100% |
[Boundary of calculations]
All sites of Lansinoh Laboratories Inc
[Verification Agency for calculation methodology and calculated values]
DFGE Institute for Energy, Ecology and Economy
https://dfge.de/
CO2 Reduction and Energy Conservation Initiatives
Pigeon Group's Energy Consumption
Recognizing the need to address climate change and conserve depletable energy sources, we are working to save energy and switch to renewable energy at our facilities. Our total energy consumption in 2021 was 52,022MWh. The largest proportion of this was made up of electricity, which accounted for 71%.
|
Energy carriers |
FY2021 Consumption (MWh) |
| Fuel | 12,708 |
| Purchased electricity | 36,962 |
| Purchased heat | 24 |
| Electricity generated by own solar panels installed at our manufacturing sites | 2,328 |
| Total | 52,022 |
[Boundary of calculations]
Pigeon Corporation and all of the consolidated subsidiaries in Japan and overseas. (Coverage is 100%)
[Calculation method]
Fuel consumption is calculated based on higher heating values specified in the Energy Saving Act in Japan.
Use of Renewable Energy
The Pigeon Group advances the use of renewable energy as a means of reducing emissions of greenhouse gases. In 2021 renewable energy comprised 9.3% of total energy consumed by the Group, contributing to a 2,127 tonnes reduction in CO2 emissions.
On August 1, 2021, the Pigeon Group’s head office in Chuo Ward, Tokyo began purchasing renewable energy. The Group head office thus became the first Pigeon Group facility to achieve 100% use of renewable energy, reducing CO2 emissions by 63 tonnes per year.
The Group began introducing solar power generation facilities in May 2019 with projects in two Group companies located in China, Pigeon Industries (Changzhou) Co., Ltd. and Pigeon Manufacturing (Shanghai) Co., Ltd. Subsequently, solar power generation facilities were introduced at Pigeon India Pvt. Ltd. in October 2019, at PT Pigeon Indonesia in September 2020, at Thai Pigeon Co., Ltd. in Thailand in January 2021 and at Pigeon Manufacturing Hyogo Corporation in Japan in May 2022.
In Japan, Pigeon Manufacturing Hyogo Corporation and Pigeon Manufacturing Ibaraki Corporation have purchased electricity from renewable sources since FY2020.
In addition, we have begun purchasing renewable energy electricity certificates starting in FY2020.
The Pigeon Group will continue to expand its adoption of renewable energy in Japan and overseas, and further advance our efforts for reduction of greenhouse gas emissions.

| FY2019 | FY2020 | FY2021 | |||||||
| Amount of Usage (MWh) |
Ratio of Electricity Consumption of Pigeon Group (%) | CO2 Reduction (tonnes of CO2) |
Amount of Usage (MWh) |
Ratio of Electricity Consumption of Pigeon Group (%) | CO2 Reduction (tonnes of CO2) |
Amount of Usage (MWh) |
Ratio of Electricity Consumption of Pigeon Group (%) | CO2 Reduction (tonnes of CO2) |
|
| Electricity generated from renewable energy sources | 880 | 2.2% | 711 | 1,928 | 4.9% | 1,233 | 3,649 | 9.3% | 2,127 |
|---|---|---|---|---|---|---|---|---|---|
|
Of which, electricity generatd by own solar panels installed at our manufacturing sites |
880 | 2.2% | 711 | 1,159 | 2.9% | 944 | 2,328 | 5.9% | 1,617 |
|
PIGEON INDUSTRIES (CHANGZHOU) CO., LTD. |
578 | 1.4% | 465 | 774 | 2.0% | 623 | 743 | 1.9% | 588 |
|
PIGEON MANUFACTURING (SHANGHAI) CO., LTD. |
255 | 0.6% | 205 | 156 | 0.4% | 126 | 295 | 0.8% | 234 |
|
PIGEON INDIA PVT. LTD |
47 | 0.1% | 40 | 217 | 0.5% | 184 | 263 | 0.7% | 208 |
|
PT PIGEON INDONESIA |
- | - | - | 12 | 0.03% | 10 | 198 | 0.5% | 173 |
|
THAI PIGEON CO., LTD. |
- | - | - | - | - | - | 829 | 2.1% | 414 |
|
Of which, purchased electricty from renewable energy sources |
- | - | - | 769 | 1.9% | 289 | 1,321 | 3.4% | 510 |
| Renewable Energy Certificates Purchased | - | - | - | 1,855 | 4.7% | 800 | 3,364 | 8.6% | 1,462 |
Our efforts to reduce CO2 Emissions in Logistics
To reduce CO2 emissions through logistics, we are shortening transportation distances, reducing transportation frequency, and switching to transportation methods that emit less CO2.
1. Reduction of transportation distance
We are working to shorten transportation distances by reviewing unloading locations and shipping bases.
- Shortened transportation distances by eliminating our own logistics bases and outsourcing to outside logistics providers located near ports (PIGEON MALAYSIA (TRADING) SDN.BHD.).
- Shortened the transportation distance of industrial waste by changing the industrial waste processor (PIGEON INDUSTRIES (THAILAND) CO.)
- Changed the port of shipment for imported raw materials to shorten the transportation distance (LANSINOH LABORATORIES MEDICAL DEVICES DESIGN INDUSTRY AND COMMERCE LTD.)
2. Reduction of transportation frequency
We are working to reduce the frequency of transportation by improving loading efficiency, reducing the percentage of empty vehicles, and improving procurement efficiency in cooperation with suppliers.
- Efforts are underway to change the number of items placed in the outer box, the method of packing in the box, and the size of the outer box (Pigeon Corporation).
- Reviewing packaging specifications to eliminate the need for inner layer material (Lansinoh Group)
- Collaborated with suppliers of secondary materials to improve the accuracy of demand forecasting and inventory control, and to reduce the frequency of transportation. (LANSINOH LABORATORIES MEDICAL DEVICES DESIGN INDUSTRY AND COMMERCE LTD.CO., PIGEON SINGAPORE PTE.LTD. and PIGEON MALAYSIA (TRADING) SDN.BHD.)
- Switched from wooden pallets to paper slip sheets, forest certified, and improved loading rates and significantly reduced transportation weight (LANSINOH LABORATORIES MEDICAL DEVICES DESIGN INDUSTRY AND COMMERCE LTD.CO., LANSINOH LABORATORIES, INC.)
3. Switching to transportation methods that emit less CO2
We are also switching to trucks that use cleaner fuels for transportation.
- Use of natural gas and biodiesel vehicles (THAI PIGEON CO., LTD.)
Developing Carbon Neutral (Climate Neutral) Products
Our Lansinoh business is actively working toward greenhouse gas (GHG) emissions reduction goals based on scientific evidence. To begin with, Lansinoh has completely switched to renewable energy for the electric power used at all of its sites. It has also calculated the full carbon footprint of its main products, opened negotiations with suppliers about using renewable energy in order to reduce their emissions, and begun actively working toward GHG emissions reduction at the product level. In 2021, Lansinoh was the first company in the Pigeon Group to launch products certified climate-neutral by a third party (the DFCE Institute). The products are certified climate-neutral because Lansinoh has determined their GHG emissions over their entire life cycle (from raw material procurement to disposal after use) and is not only independently working to reduce these emissions but also striving to compensate for emissions that are difficult to eliminate by purchasing climate credits, which support activities by environmental groups certified to reduce and absorb greenhouse gases.

Other Initiatives
・Eliminating electricity generation from fuel oil
In order to reduce GHG emissions, in fiscal 2020 we stopped using electric generators that use fuel oil. (Pigeon Manufacturing Hyogo)
・Energy efficiency through LED lighting
We are making progress on the changeover to LED lighting, and using less electricity in our offices and other sites. (Central Laboratory, Tsukuba office, Pigeon Manufacturing Ibaraki)
Further Initiatives
Although we have not introduced ICP (Internal Carbon Pricing), we are discussing the setting of long-term reduction targets in consideration of the future rise of carbon taxes and Japan's reduction target of carbon neutrality by 2050. During the discussion process, we refer to the IEA's forecast of carbon tax increase in order to promote shifts to renewable energy, application of renewable energy certificates, and capital investment for the purpose of energy conservation and on-sites renewable energy generation.
Response to CDP Climate Change Questionnaire
Pigeon responded to CDP Climate Change Questionnaire 2022 conducted by CDP, a not-for-profit charity that runs the global disclosure system for investors, companies, cities, states and regions to manage their environmental impacts. Please see below for our responses (Japanese language only).
(Scope 1 & 2) 10% from 2018 base year.